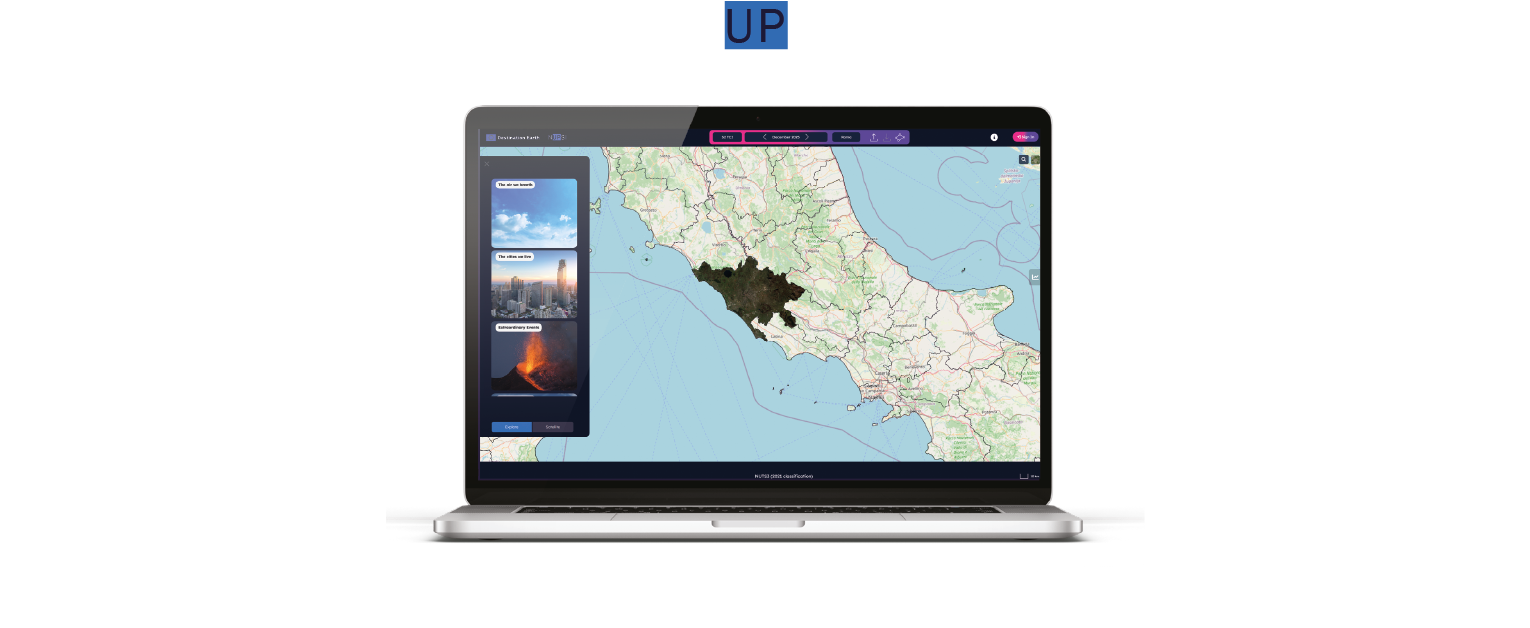
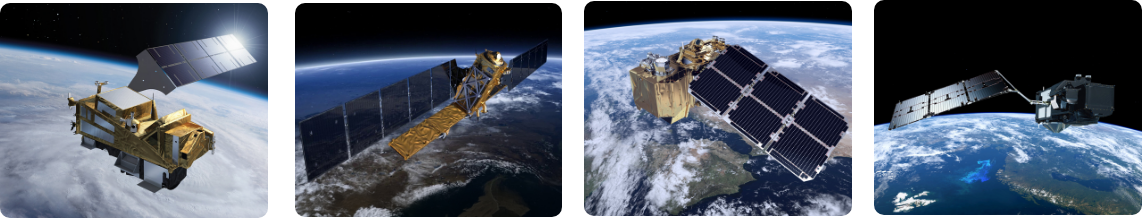
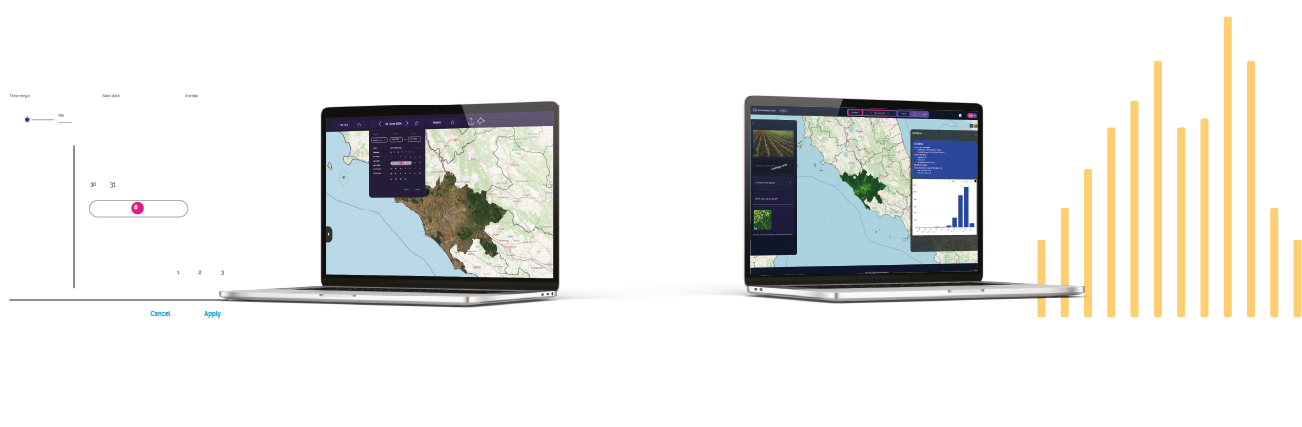
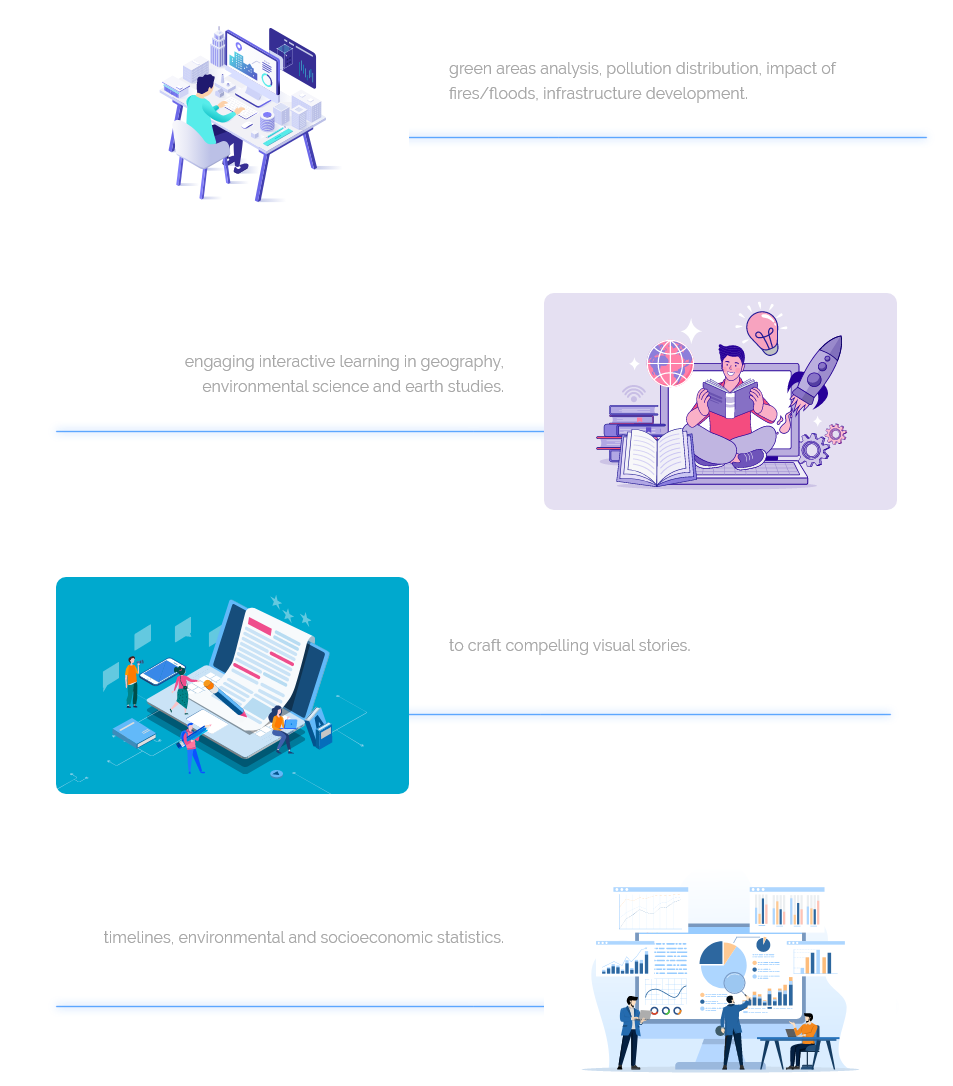
Systematic and on-demand satellite images tailored over Europe Administrative Areas (NUTS) go to service Different visualization of data depending on the user needs Exploring thematic areas The air we breathThe cities we liveExtraordinary eventsFrozen landscapeWater on landLand life and useOcean insight Based on the source satellite Sentinel 1Sentinel 2Sentinel 3Sentinel 5P go to service Customised processing, tailoring the spatial and time range over source EO data Areas of interest can be searched with: NUPSI easy access to EO data tailored over administrative areas, is a powerful support tool for Features Band Math Visuliser: Visualization algorithms are elaborated on the fly thanks to a specific middleware service (titiler). On-demand Processing: User requests are served by customised visualisers dynamically hosted on a K8S infrastructure. Systematic processing: Copernicus satellite datas are collected, processed (merged and tailored over NUTS) and stored on S3 buckets. User Storage: Requests are made available for visualization/download in a private workspace. Indexing: All produced data are available through a STAC index. CDN: Content Delivery Network allows to cache images and optimize the performance for timeline visualizations go to service